
After turning an old Android phone into a small server using Termux, Samba, File Browser, and Tailscale, I wanted one place where I could quickly see whether everything was working.

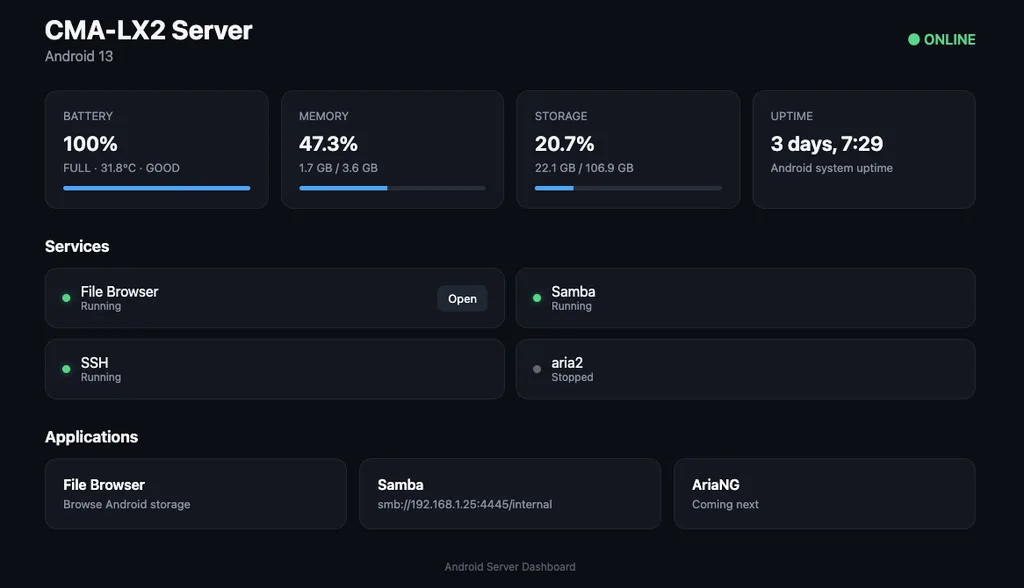
Instead of installing a heavy dashboard such as Dashy or Homepage, I built a very small monitoring dashboard using Python.
The dashboard shows:
- Battery percentage and temperature
- RAM usage
- Internal storage usage
- Android uptime
- System load
- Wi-Fi IP address
- Wi-Fi signal strength
- Wi-Fi link speed
- Samba status
- File Browser status
- SSH status
- aria2 status
- Shortcuts to installed services
The final result looks something like this:
HONOR SERVER                         ● ONLINE

BATTERY       MEMORY       STORAGE       UPTIME
78%           54%          13%           8h 42m
Charging      2 / 3.6 GB   13 / 107 GB

NETWORK & SYSTEM

LOCAL IP        WI-FI LINK      SIGNAL       SYSTEM LOAD
192.168.1.25    72 Mbps         -42 dBm      1.8, 2.1, 2.4

SERVICES

● File Browser                     OPEN
● Samba
● SSH
○ aria2
The whole thing runs directly inside Termux and uses almost no resources.
1. Install Python in Termux
Update Termux:
pkg update
Install Python:
pkg install python
Check:
python --version
Now create a folder for the dashboard:
mkdir -p ~/dashboard
cd ~/dashboard
2. Install Termux:API
Some Android information, especially battery and Wi-Fi information, cannot be read directly from /proc or /sys on modern Android versions.
For example, on my Honor phone:
cat /proc/uptime
returned:
Permission denied
and:
ls /sys/class/power_supply/
also returned:
Permission denied
This is caused by Android security restrictions.
The solution is to use Termux:API.
If your Termux installation comes from F-Droid, install the Termux:API companion app from F-Droid as well.
Then install the command-line package:
pkg install termux-api
Test:
termux-battery-status
A working result looks similar to:
{
  "health": "GOOD",
  "percentage": 78,
  "plugged": "PLUGGED_AC",
  "status": "CHARGING",
  "temperature": 31.5
}
3. Test Wi-Fi Information
Run:
termux-wifi-connectioninfo
On my Honor phone, it returned:
{
  "frequency_mhz": 2417,
  "ip": "192.168.1.25",
  "link_speed_mbps": 72,
  "rssi": -42,
  "ssid": "<unknown ssid>"
}
That gives us several useful dashboard values:
Local IP        192.168.1.25
Link speed      72 Mbps
Signal          -42 dBm
Frequency       2417 MHz
Wi-Fi band      2.4 GHz
Android may hide the SSID and MAC address for privacy, so I simply ignore those values.
4. Get Android Uptime
On my phone:
cat /proc/uptime
was blocked.
However:
/system/bin/uptime
worked.
Example:
00:13:07 up 1:12, 0 users, load average: 4.79, 5.67, 5.84
This gives us:
Uptime       1 hour 12 minutes
Load         4.79, 5.67, 5.84
The load values represent approximately:
1 minute
5 minutes
15 minutes
5. Create the Dashboard
Create:
nano ~/dashboard/dashboard.py
Start with these imports:
import json
import shutil
import subprocess
from http.server import BaseHTTPRequestHandler, ThreadingHTTPServer
Set the port:
PORT = 8090
6. Read RAM Usage
Android still allowed Termux to read:
/proc/meminfo
So we can calculate RAM usage with Python:
def get_memory():
    total = 0
    available = 0

    try:
        with open("/proc/meminfo") as f:
            for line in f:
                if line.startswith("MemTotal:"):
                    total = int(line.split()[1]) * 1024

                elif line.startswith("MemAvailable:"):
                    available = int(line.split()[1]) * 1024
    except Exception:
        pass

    used = total - available

    return {
        "total": total,
        "used": used,
        "percent": round((used / total) * 100, 1) if total else 0,
    }
7. Read Android Storage Usage
Python can read the shared-storage filesystem directly:
def get_storage():
    try:
        usage = shutil.disk_usage("/storage/emulated/0")

        return {
            "total": usage.total,
            "used": usage.used,
            "free": usage.free,
            "percent": round(
                (usage.used / usage.total) * 100,
                1
            ),
        }

    except Exception:
        return {
            "total": 0,
            "used": 0,
            "free": 0,
            "percent": 0,
        }
On my phone this showed approximately:
13.3 GB / 106.9 GB
8. Read Battery Information
Because Android blocked direct battery access, use:
termux-battery-status
from Python:
def get_battery():
    try:
        result = subprocess.run(
            ["termux-battery-status"],
            stdout=subprocess.PIPE,
            stderr=subprocess.DEVNULL,
            text=True,
            timeout=3,
        )

        data = json.loads(result.stdout)

        return {
            "capacity": data.get("percentage"),
            "status": data.get("status", "Unknown"),
            "temperature": data.get("temperature"),
            "health": data.get("health"),
            "plugged": data.get("plugged"),
        }

    except Exception:
        return {
            "capacity": None,
            "status": "Unknown",
            "temperature": None,
            "health": None,
            "plugged": None,
        }
This lets the dashboard display:
BATTERY
78%

CHARGING · 31.5°C · GOOD
9. Get Uptime and System Load
Use Android’s own uptime command:
def get_uptime():
    try:
        output = subprocess.check_output(
            ["/system/bin/uptime"],
            stderr=subprocess.DEVNULL,
            text=True,
            timeout=2,
        ).strip()

        if " up " in output:
            uptime = output.split(" up ", 1)[1]

            if ",  0 user" in uptime:
                uptime = uptime.split(",  0 user", 1)[0]

            elif ",  1 user" in uptime:
                uptime = uptime.split(",  1 user", 1)[0]

            return uptime.strip()

    except Exception:
        pass

    return "Unknown"
For load average:
def get_load_average():
    try:
        output = subprocess.check_output(
            ["/system/bin/uptime"],
            stderr=subprocess.DEVNULL,
            text=True,
            timeout=2,
        ).strip()

        if "load average:" in output:
            return output.split(
                "load average:",
                1
            )[1].strip()

    except Exception:
        pass

    return "Unknown"
10. Read Wi-Fi Information
Use Termux:API:
def get_network():
    try:
        result = subprocess.run(
            ["termux-wifi-connectioninfo"],
            stdout=subprocess.PIPE,
            stderr=subprocess.DEVNULL,
            text=True,
            timeout=3,
        )

        data = json.loads(result.stdout)

        frequency = data.get("frequency_mhz", 0)

        if frequency >= 5000:
            band = "5 GHz"

        elif frequency >= 2400:
            band = "2.4 GHz"

        else:
            band = "Unknown"

        return {
            "ip": data.get("ip", "Unknown"),
            "link_speed": data.get("link_speed_mbps"),
            "rssi": data.get("rssi"),
            "frequency": frequency,
            "band": band,
        }

    except Exception:
        return {
            "ip": "Unknown",
            "link_speed": None,
            "rssi": None,
            "frequency": None,
            "band": "Unknown",
        }
11. Monitor Termux Services
We can check whether a process is currently running using pgrep.
def service_running(name):
    try:
        result = subprocess.run(
            ["pgrep", "-x", name],
            stdout=subprocess.DEVNULL,
            stderr=subprocess.DEVNULL,
        )

        return result.returncode == 0

    except Exception:
        return False
Now we can monitor:
"services": {
    "filebrowser": service_running("filebrowser"),
    "samba": service_running("smbd"),
    "ssh": service_running("sshd"),
    "aria2": service_running("aria2c"),
}
This produces a simple status display:
● File Browser      Running
● Samba             Running
● SSH               Running
○ aria2             Stopped
12. Create the Status API
The Python server can expose all the information as JSON.
For example:
http://192.168.1.25:8090/api/status
might return:
{
  "battery": {
    "capacity": 78,
    "status": "CHARGING",
    "temperature": 31.5
  },

  "memory": {
    "percent": 54.5
  },

  "storage": {
    "percent": 12.5
  },

  "network": {
    "ip": "192.168.1.25",
    "link_speed": 72,
    "rssi": -42,
    "band": "2.4 GHz"
  },

  "services": {
    "filebrowser": true,
    "samba": true,
    "ssh": true,
    "aria2": false
  }
}
This also makes it easy to build another frontend later.
13. Serve the Dashboard
The HTTP server can listen on all interfaces:
server = ThreadingHTTPServer(
    ("0.0.0.0", 8090),
    Handler
)

server.serve_forever()
Start it:
cd ~/dashboard
python dashboard.py
You should see:
Android Server Dashboard
Listening on 0.0.0.0:8090
14. Open the Dashboard
From another device on the same Wi-Fi:
http://192.168.1.25:8090
If Tailscale is installed:
http://TAILSCALE_IP:8090
This lets you monitor the phone remotely from anywhere.
15. Make Service Links Automatically Follow the Current IP
One useful trick is to avoid hardcoding the IP address.
In JavaScript:
const host = window.location.hostname;
Then File Browser can use:
const fileBrowserURL =
    "http://" + host + ":8080";
This means:
If you access the dashboard using:
http://192.168.1.25:8090
the File Browser button opens:
http://192.168.1.25:8080
But if you access it using Tailscale:
http://100.x.x.x:8090
the same button automatically opens:
http://100.x.x.x:8080
No hardcoded IP address is required.
16. Add Samba Information
Samba itself cannot be opened in a web browser, but the dashboard can show its connection address:
"smb://" + host + ":4445/internal"
For example:
smb://192.168.1.25:4445/internal
or remotely:
smb://100.x.x.x:4445/internal
17. Auto-Start the Dashboard After Reboot
Create:
nano ~/.termux/boot/30-dashboard
Add:
#!/data/data/com.termux/files/usr/bin/sh

sleep 20

if ! pgrep -f dashboard.py >/dev/null 2>&1; then

    cd "$HOME/dashboard"

    nohup python dashboard.py \
        > dashboard.log 2>&1 &

fi
Make it executable:
chmod +x ~/.termux/boot/30-dashboard
Your boot directory may now contain:
~/.termux/boot/

10-filebrowser
20-samba
30-dashboard
After Android boots:
File Browser starts
Samba starts
Dashboard starts
Tailscale reconnects
The phone becomes remotely accessible again without manually opening Termux.
18. Check the Dashboard Process
Run:
pgrep -af dashboard.py
To stop it:
pkill -f dashboard.py
To start it manually in the background:
cd ~/dashboard

nohup python dashboard.py \
    > dashboard.log 2>&1 &
Check the log:
tail -f ~/dashboard/dashboard.log
19. Android Restrictions We Encountered
Modern Android blocks several normal Linux monitoring methods.
On my Honor Android 13 phone:
cat /proc/uptime
returned:
Permission denied
This also failed:
cat /proc/net/dev
And:
ip -o -4 addr show wlan0
returned:
Cannot bind netlink socket:
Permission denied
Battery sysfs access was also blocked:
ls /sys/class/power_supply/
returned:
Permission denied
Instead of trying to bypass Android security, I used:
/system/bin/uptime
termux-battery-status
termux-wifi-connectioninfo
/proc/meminfo
Python disk_usage()
These were enough for a useful monitoring dashboard.
20. Other Sensors Available Through Termux
Termux:API can also access Android sensors:
termux-sensor -l
My Honor exposed sensors including:
Accelerometer
Magnetometer
Ambient Light
Proximity
Device Orientation
Motion Detection
Stationary Detection
Step Counter
For example:
termux-sensor \
    -s "stk_stk3a5x Ambient Light Sensor Non-wakeup" \
    -n 1
This means the dashboard could eventually display:
Ambient Light      82 lux
Orientation        Portrait
Proximity          Far
Motion             Stationary
For a server dashboard these are optional, but they show how much Android hardware Termux can access.
21. Future Services
The dashboard was intentionally designed so additional services can be added later.
For example:
aria2
AriaNG
Syncthing
Jellyfin
WebDAV
Download manager
Backup service
MQTT broker
Home automation tools
The dashboard can simply add another service card:
● aria2
● AriaNG
● Syncthing
along with a button to open its web interface.
Final Result
The old Android phone now has its own lightweight monitoring interface:
Android Phone
│
├── Termux
│   │
│   ├── Samba
│   ├── File Browser
│   ├── SSH
│   └── Python Dashboard :8090
│
├── Termux:API
│   ├── Battery
│   ├── Wi-Fi
│   └── Sensors
│
└── Tailscale
       │
       ▼

Remote browser

http://100.x.x.x:8090
Instead of installing a large server dashboard, a few hundred lines of Python and HTML gave me exactly the information I needed.
It uses very little RAM, starts automatically after reboot, works over both local Wi-Fi and Tailscale, and can grow alongside the Android server as more services are installed.
For a lightweight Termux home server, this turned out to be one of the most useful additions.